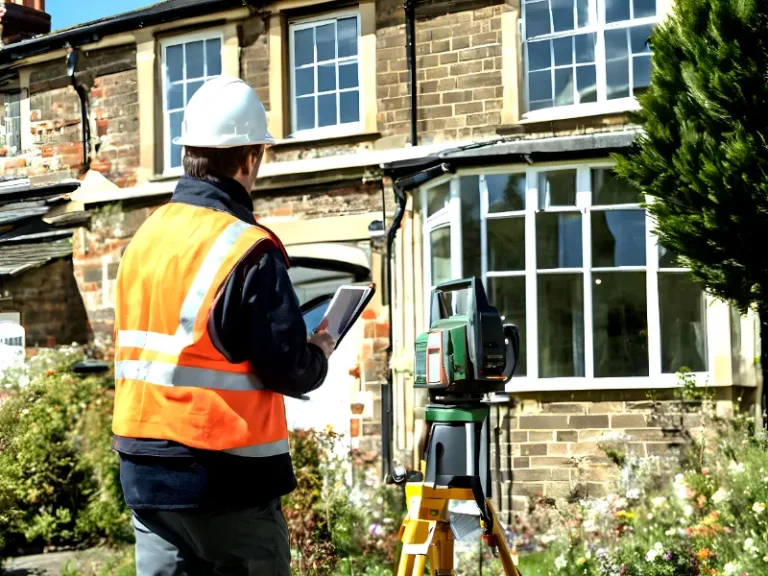
Topographic maps are more than just lines and symbols on paper; they are a gateway to understanding the physical features of the Earth’s surface. Whether planning a hike, being involved in land surveying, or simply being curious about the world, learning to read a topographic map is essential. These maps are uniquely detailed, providing a three-dimensional view of terrain on a two-dimensional surface, enabling you to visualize the landscape in a way few other maps can offer.
But why does this matter to you?
Perhaps you’re an outdoor enthusiast who loves exploring new trails, or you’re a construction or environmental planning professional. Whatever your interest, understanding topographic maps can enhance your experience, improve your safety, and even lead you to discover new adventures.
This blog will walk you through the essentials of reading a topographic survey map, ensuring you feel confident and prepared to steer the great outdoors or tackle your next project.
📍 Struggling to Interpret Topographic Maps?
Understanding elevation, contours, and terrain features is crucial for planning and development. Let Survey2Plan provide expert mapping solutions!
📞 0161 531 6641 📩 info@survey2plan.com 💬 Get a Quotation
Fast & Accurate Surveys | Trusted by Architects, Developers & Contractors
Topographic Map
Topographic maps depict a three-dimensional landscape in two dimensions. Primary landmarks in the area are displayed.
- Man-made objects like roads, buildings, railroad tracks, and airports
- Sources of water such as lakes, streams, rivers, and swamps
- Areas of vegetation (or lack thereof) like vineyards, orchards, forests, and open areas — places that are almost always snow-covered or open fields
- Other natural features such as mountains, valleys, and cliffs
The most helpful aspect of topographic maps is their accurate depiction of the land’s contours; these maps indicate the exact locations and rates of elevation changes, which can help you decide how to approach a mountain or a valley or even whether to face them at all!
This means that topographic maps are handy tools. Government agencies use them to help with urban planning and development, mining, and emergency or rescue missions.
Parts of a Topographic Map
1. Legend
The most important part is the legend, which shows:
- Map’s name
- Year of production or when the map was made initially.
- Year of revision or last updated.
- A dot or a rectangle within the borders of a state, province, territory, etc., indicates the general location within the region.
- The name of the adjacent quadrangle map corresponds to the region neighbouring the current map, such as the northeast quadrant.
2. Scale
The scale displays the proportion between the distance on the map and the distance on the ground. There are three types of scales:
- Of the three, a verbal scale is the most basic. It establishes a relationship between feet, meters, miles, or kilometres on the ground and inches or centimetres on the map, such as 1 inch = 2000 feet.
- A fraction (1/62500) or a ratio (1:62500) can represent a fractional scale. Units may or may not be connected. You can make your own if there aren’t any; for example, one map inch equals 62,500 ground inches, one map centimetre equals 62,500 ground centimetres, and so on. Then, you would convert your selected unit to miles, kilometres, feet, or meters.
- A line on a map to indicate ground and map units is called a bar scale. Frequently, it will be divided into smaller, numbered portions. For instance, the bar will run from 0 to 5 if it represents five miles. To help you understand the numbers, count the number of boxes on the scale. There will be five boxes on a 5-mile scale. Bar scales have the advantage over word and fractional scales in that they remain valid even if you want to enlarge or downsize your map. Remember this when you select your map.
3. Magnetic Declination
- The magnetic declination, or the difference between true north (the location of the North Pole) and magnetic north (the direction your compass needle will point). Declination varies depending on your location, and if you don’t account for it, you could end up in a completely different location from where you aim to go. The symbol on your map shows the declination for where you’ll be hiking so you can adjust your compass accordingly for an accurate reading and bearing.
- Latitude and longitude.
The colours and symbols are listed in the map’s key or legend, so getting to know them will save you time.
The colours on a topographic map distinguish between types of landmarks. For example:
- Red is for roads
- Black is for man-made objects.
- Blue is for water.
- Green is for vegetation.
- White is for areas with sparse vegetation or none. This could include desert, grass, sand, rocks, snow, boulders, etc.
- Purple is for features added to the map due to aerial photographs but not checked in the field.
4. Colours and Symbols
The colours and symbols are listed in the map’s key or legend, so getting to know them will save you time.
The colours on a topographic map distinguish between types of landmarks. For example:
- Red is for roads
- Black is for man-made objects.
- Blue is for water.
- Green is for vegetation.
- White is for areas with sparse vegetation or none. This could include desert, grass, sand, rocks, snow, boulders, etc.
- Purple is for features added to the map due to aerial photographs but not checked in the field.
5. Boundaries
- Although boundaries aren’t physical characteristics, they are essential to understand since they indicate when you enter a national forest or depart from one city, county, or state to another.
- They are indicated with dashes and broken lines of additional dots for specific boundaries.
6. Benchmarks
Benchmarks indicate the locations of elevation surveys. If a marker was buried there, it is denoted with a triangle; otherwise, it is marked with an X.
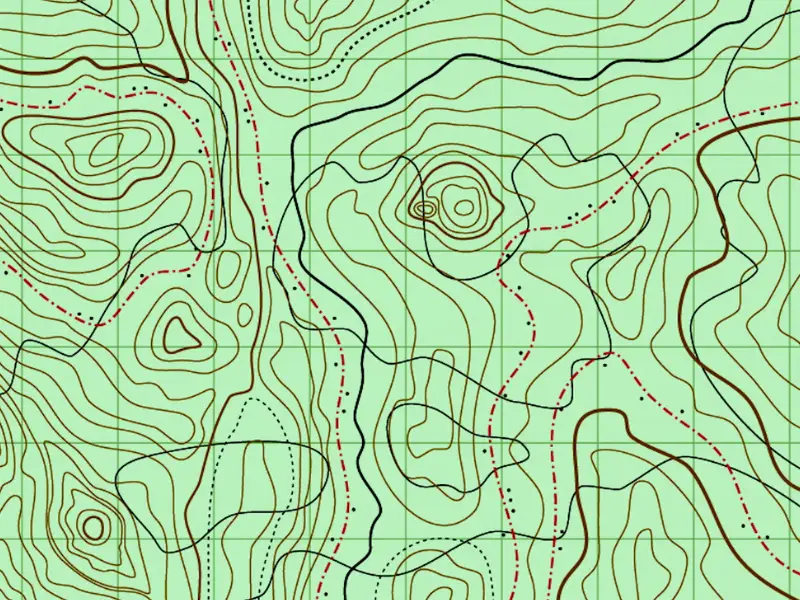
7. Contour Lines
How to Read a Contour Map?

Reading Contour Lines
Contour lines are drawn around areas with the same elevation, and the space between them represents an elevation change. They are also drawn to mirror the contours of the terrain. They provide an image of the topography and indicate any elevation changes in the ground.
How to read contour lines? To find the elevation change, follow the contour lines and elevation signs. The greater the climb or fall on a map, the closer the contour lines are together.
Additionally, keep in mind that contour lines won’t show every hump on your path. There won’t be any indication if there is an abrupt shift in height between them.
How do you determine contour intervals?
Topo Map Reading
Next, you want to combine your knowledge of contour lines and intervals to determine what they mean. For instance:
- When contour lines are close together, the slope is steep.
- When the lines are spaced farther apart, the slope is more gentle.
- If the contour lines create a V shape that points uphill, it indicates a valley. This often means a stream or river flows downhill from a higher elevation.
- If the V shape points downhill, it represents a ridge.
- A single contour line in a circle without others marks a summit or the highest point.
- If you see circles with short lines on the inside, that shows a depression or a recessed area in the landscape.
Applications in Architecture and Construction
1. Site Analysis and Selection
Architects rely heavily on topographical maps to assess potential building sites, using them as essential for evaluating the terrain’s suitability for construction projects. Here’s how they use these maps:
- Investigate slope gradients to determine the steepness or flatness of the land.
- Analyse drainage patterns to understand how water flows across the site.
- Examine soil conditions to ensure the ground is stable enough for building.
- Identify natural features such as hills, valleys, and forests.
- Discover the best placements for construction and site development.
- Assess the surrounding environment, including vegetation coverage and water bodies.
- Consider nearby infrastructure, such as roads and utilities, that could impact the site.
- Address potential challenges and mitigate risks associated with the chosen location.
- Utilize modern mapping technology and data analysis methods to enhance the accuracy of site assessments.
- Ensure that buildings are visually appealing but also sustainable and resilient to environmental factors.
2. Grading and Earthwork Design
Architects rely heavily on topographical maps to assess potential building sites, using them as essential for evaluating the terrain’s suitability for construction projects. Here’s how they use these maps:
- Investigate slope gradients to determine the steepness or flatness of the land.
- Analyse drainage patterns to understand how water flows across the site.
- Examine soil conditions to ensure the ground is stable enough for building.
- Identify natural features such as hills, valleys, and forests.
- Discover the best placements for construction and site development.
- Assess the surrounding environment, including vegetation coverage and water bodies.
- Consider nearby infrastructure, such as roads and utilities, that could impact the site.
- Address potential challenges and mitigate risks associated with the chosen location.
- Utilize modern mapping technology and data analysis methods to enhance the accuracy of site assessments.
- Ensure that buildings are visually appealing but also sustainable and resilient to environmental factors.
3. Environmental Considerations
Architects rely heavily on topographical maps to assess potential building sites, using them as essential for evaluating the terrain’s suitability for construction projects. Here’s how they use these maps:
- Investigate slope gradients to determine the steepness or flatness of the land.
- Analyse drainage patterns to understand how water flows across the site.
- Examine soil conditions to ensure the ground is stable enough for building.
- Identify natural features such as hills, valleys, and forests.
- Discover the best placements for construction and site development.
- Assess the surrounding environment, including vegetation coverage and water bodies.
- Consider nearby infrastructure, such as roads and utilities, that could impact the site.
- Address potential challenges and mitigate risks associated with the chosen location.
- Utilize modern mapping technology and data analysis methods to enhance the accuracy of site assessments.
- Ensure that buildings are visually appealing but also sustainable and resilient to environmental factors.
4. Visualisation and Communication
Conclusion
Architects, engineers, and other building and urban planning experts rely heavily on topography maps. By partnering with a topographic survey company, architects can ensure their designs are both sustainable and perfectly aligned with the natural landscape.
These maps fully explain the detailed physical characteristics of the terrain, such as slopes, elevation variations, and natural landmarks. Having access to such comprehensive data is essential for making well-informed decisions throughout the design and construction process.
Architects use topography maps to optimise site planning. This ensures that projects blend in with the surrounding environment and minimises any potential obstacles posed by the terrain.
Furthermore, these maps improve design efficiency by helping architects foresee and solve problems like drainage, soil stability, and accessibility. By including topography mapping in their work, architects can encourage a comprehensive approach to project management that emphasizes sustainability and environmental stewardship. Using the abundance of information offered by topography maps, architects may produce aesthetically beautiful and valuable designs while adding to build environments’ long-term resilience and vitality.